

Deploying AI agents requires continuous monitoring to ensure they operate reliably, efficiently, and in line with expected business objectives as they execute complex, multi-step tasks in production. Here’s what organizations need to know to observe, evaluate, and control agents at scale effectively.
As organizations entrust autonomous and semi-autonomous agents with increasingly high-stakes responsibilities, continuous monitoring ensures they operate efficiently and align with organizational objectives.
Unlike large language models (LLMs) and chatbots that simply generate text responses, autonomous AI agents operate independently. They can modify databases, use external tools, and trigger actions in other systems without needing human approval.
While agents’ autonomy promotes efficiency and scales outcomes, it also comes with risks: hallucinations, faulty decision-making, runaway execution loops, cascading errors, costly workflows, and so on. A faulty agent can degrade customer experiences, slow down work, create safety concerns, or drain operational budgets.
Fortunately, you can mitigate these risks by properly monitoring agent behavior and performance in production. In this guide, we'll explore the differences between agent monitoring and agent observability, why monitoring AI agents is hard, and the key metrics teams should track to ensure reliability, performance, and cost efficiency.
What Is the Difference Between Agent Monitoring, Agent Observability, and LLM Observability?
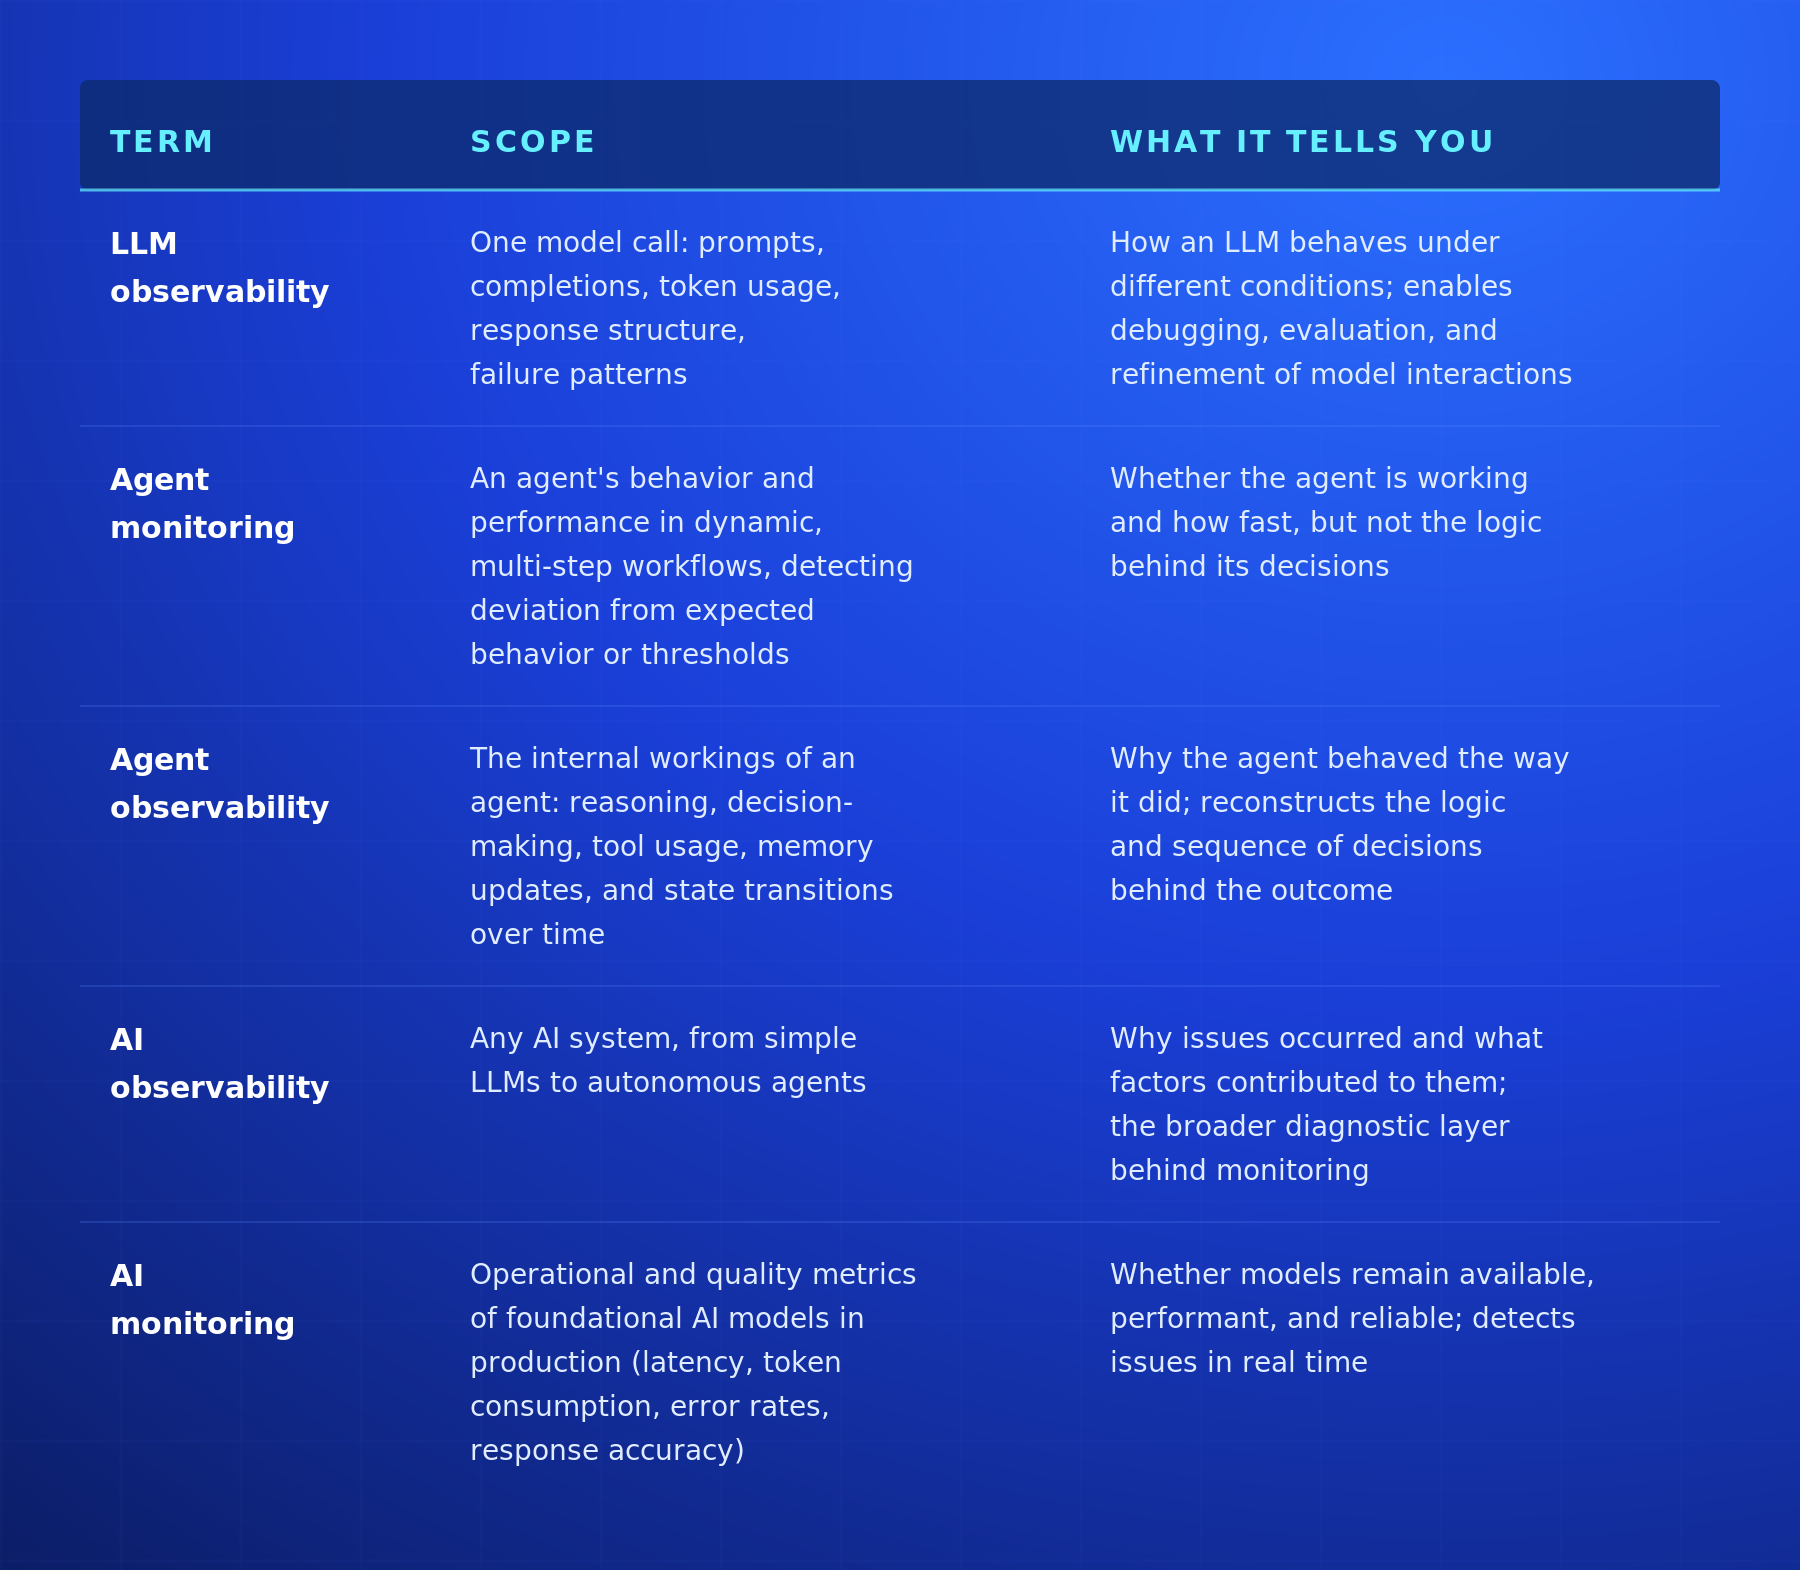
Agent monitoring alerts you when something goes wrong in multi-step agent workflows that involve reasoning, tool use, memory, and decision-making, while agent observability focuses on the logic behind an agent’s decisions. LLM observability provides visibility into how a language model processes inputs and generates outputs. AI monitoring helps in detecting performance issues and incidents, while observability diagnoses root causes and explains the AI’s behavior.
Let’s go into more detail.
AI monitoring tracks the health, performance, and behavior of foundational AI models in production. Its primary goal is to detect issues in real time and maintain service quality.
It measures operational and quality metrics such as latency, token consumption, error rates, and response accuracy so teams can keep models available, performant, and reliable.
AI observability is the broader discipline encompassing visibility into all AI systems, ranging from simple chatbots to powerful autonomous agents. While monitoring focuses on detecting incidents and performance issues in real time, observability goes a step further by helping teams understand why those issues occurred and what factors contributed to them.
In the context of AI agents, observability reveals why an agent behaved the way it did by tracing autonomous decisions, multi-step workflows, tool calls, and handoffs.
AI agent monitoring tracks the behavior and performance of autonomous or semi-autonomous agents with dynamic, multi-step workflows. Its primary goal is to identify incidents and performance degradations in real time.
Unlike stateless models, AI agents can decompose complex tasks into actionable steps, use external tools, and continuously evaluate their progress without needing human approval at every turn. Monitoring lets teams detect deviations from expected behavior or issues in the underlying production infrastructure.
AI agent observability is the ability to understand why an autonomous agent behaved the way it did throughout a multi-step workflow. Unlike agent monitoring, which identifies when something goes wrong, agent observability explains why it happened by reconstructing the logic and sequence of decisions that led to the outcome. It traces the agent’s reasoning, decision-making, tool usage, memory updates, and state transitions over time.
LLM observability provides deep visibility into how large language models process inputs and generate outputs, often extending beyond basic performance metrics into intermediate signals such as prompts, token usage, response structure, and failure patterns. It helps practitioners understand how an LLM behaves under different conditions, enabling debugging, evaluation, and refinement of model interactions.
Why Is It Hard To Monitor AI Agents?
Agent monitoring is challenging mostly because agents behave so differently from traditional software systems. Based on a prompt, an agent can decide to call APIs, fetch data from multiple sources, create outcomes, and interact with external systems in ways that are hard to predict.
Yet monitoring remains critical for organizations running agents in production. Without it, you might see your agent working well and making decisions, but have no idea whether it’s drifting from business objectives, wrongly modifying sensitive databases, misusing tools, or driving up operating costs.
Below are the four main reasons why monitoring AI agents is so difficult.
Non-Determinism
Software is predictable because code determines behavior. When something goes wrong, you can usually trace the issue to a specific function, service, configuration, or infrastructure bottleneck. In many cases, fixing the code or optimizing the production infrastructure resolves the problem cleanly.
Many factors can cause an AI agent to deviate from expected behavior. The issue could stem from the prompt, the model itself, tool invocation failures, low-quality retrieval results, missing context, poor reasoning steps, memory corruption, latency between systems, or interactions with external APIs. This makes debugging much harder, since the disruption often stems from multiple interacting components rather than a single identifiable bug.
Autonomous Resource Consumption
Agents don't request human permission before making API calls, invoking tools, or escalating to a more expensive model. A small tweak to the prompt can cause an agent to call additional tools, spawn multiple sub-agents, and trigger API calls, resulting in costs that far outpace the change that triggered them.
Nonlinear Execution
Agent workflows aren't linear pipelines. They loop, branch, retry on failure, and sometimes call other agents. This makes it harder to predict how much computing an agent will consume or how much it will cost to run a workflow.
Defining Failure
In a deterministic system, an incident causes visible problems, such as a part of the website failing to load or some services becoming inaccessible. In an agentic system, failure is often ambiguous. An agent can be up and running just fine while simultaneously giving incorrect answers, creating bad outcomes for your business, or costing three times what a well-designed workflow would have cost.
What To Monitor in Agents: The Three Layers of Agent Monitoring
Complete agent monitoring operates at three distinct layers. Each layer answers a different question about what the agent is doing.
Layer 1: What Happened (Traces and Spans)
Traces and spans are the fundamental units used for agent monitoring. A trace is the complete record of everything an agent did in a single run, including every API call, model use, database access, sub-agent handoff, and retry loop. Within a trace, individual operations are captured as spans, each one representing a single, distinct logical unit of work. A trace is essentially a tree of nested spans.
This structure gives you a real-time X-ray of how your agent behaves, letting you track down why a complex multi-agent system hallucinated, lagged, or failed to solve a task.
As an agent processes a task, it generates a parent-child hierarchy of spans that breaks down its execution. Common span types encountered in agent workflows include:
- Root span: The top-level span that captures the entire agent invocation and total latency.
- Agent span: Captures the activity of an individual agent, which is highly useful for debugging multi-agent orchestrations (e.g., passing control from a planner agent to a researcher agent).
- LLM span: Records individual model calls. This includes highly specific telemetry, such as prompts, tokens used, temperature settings, and model outputs.
- Tool span: Measures external API calls, calculator functions, or custom logic. It captures the specific arguments passed into the tool and the output it returned.
- Retriever/memory span: Tracks the retrieval-augmented generation (RAG) process, such as querying a vector database or consulting conversation history.
Different monitoring tools offer different ways to visualize this. However, they all provide a step-by-step representation of everything your agent does and help you track down what went wrong during execution. This could be unusual reasoning patterns, looping behaviors, or sub-agents being invoked in inappropriate contexts.
Layer 2: How Well It Worked (Evaluation)
While traces show you what happened in your agent, evaluation shows you whether it made the right decisions. This phase often involves using a supervisory agent to score another agent's outputs across metrics, such as accuracy, relevance, instruction-following, and safety. Human reviewers periodically audit a sample to calibrate the evaluator agent.
Evaluation also reveals four types of drift that are specific to agentic systems:
- Output drift: The agent's responses or outcomes gradually shift from expected baselines under the same prompts or conditions, often without any single change being obvious.
- Behavioral drift: The agent's behavior, such as reasoning style, tool usage patterns, how often it escalates to a higher model, or retry behaviors, changes over time in ways that go beyond its design.
- Evaluator drift: The gradual shift in the baseline standards of an automated LLM-as-a-judge or internal supervisor agent.
- Absence anomalies: Critical failures where an agent omits necessary actions, logic checks, or information. Typical absence anomalies include missing verification (skipping quality control and allowing runtime bugs), withholding crucial information from other agents, or omitting vital context retrieval.
Layer 3: What It Cost (And Whether It Was Worth It)
Measuring an AI agent’s operating cost and ROI is essential to ensure the technology delivers financial value. Most AI monitoring platforms treat cost as a metric; they only track cost metrics such as cost per API call, cost per inference, token efficiency, and the agent’s time to value (TTV). Tracking these metrics is important, but on their own, they’re insufficient.
Organizations need to measure the amount spent on running their agents relative to the business value they generate. Only then can they tell if the amount spent on AI is justified and identify where to make meaningful optimization decisions.
For example, consider an e-commerce company that deploys AI agents to handle routine customer inquiries such as order tracking, password resets, and returns without human intervention. Each customer interaction triggers a series of model inferences and API calls, which can be tracked using standard cost metrics like cost per inference and cost per API call. But to fully understand the ROI, the company needs to aggregate these costs and measure them against the operational savings from reduced human customer support load.
What Are the Key Metrics for Monitoring AI Agents?
Most model providers already track token counts, but this metric captures only one aspect of agent behavior. To truly understand what your agents are doing in production, you need to look out for these four types of signals:
- Behavioral signals (what the agent did): Reasoning style, tool call patterns, what triggers escalation to a higher model, loop triggers, etc.
- Performance signals (how it performed): Latency due to inter-agent or API communication, system health, GPU utilization rate, etc.
- Quality signals: Output accuracy, hallucination frequency, adherence to instructions, evaluator scores by supervisor agent, etc.
- Cost signals: Cost per API call, cost per inference, token cost efficiency, TTV, and AI ROI
Combined, these metrics provide complete visibility into the factors driving spend for your agents so you can attribute costs to specific workflows, customers, and features. Attribution turns cost data into valuable, actionable information rather than a line item on a report.
Track costs across short-term, medium-term, and long-term horizons. In the short term, measure real-time token consumption, tool-call frequency, and individual session runtime. Doing this immediately upon workflow completion helps identify cost leaks, such as bloated context windows, inefficient token usage, and endless retry/fallback loops.
In the medium term, look at recurring API usage fees, cloud hosting expenses, human handoff rates, and integration maintenance. Review these metrics monthly to optimize operational efficiency and assess whether the agent is actually saving money compared to human labor.
In the long term, consider the total cost of ownership, model retraining expenses, enterprise scaling costs, and system upgrades. Checking in on these metrics quarterly or annually helps evaluate the overall return on investment and determine if the AI agent framework scales effectively across the broader organization without exorbitant infrastructure spikes.
What To Look for in an AI Agent Monitoring Platform
When evaluating an AI agent monitoring platform, ensure it is built for the complexity of autonomous, multi-step workflows rather than simple prompt-and-response systems. Here's what to look for in a platform to determine if it’s the right choice.
Comprehensive Trace Depth and Debugging
AI agents rarely solve problems in a single step. Instead, they perform a sequence of actions such as planning, retrieving context, invoking tools, evaluating intermediate results, and adapting their approach as they work toward a goal.
Choose a platform that provides deep, hierarchical trace visibility that captures the full lifecycle of an agent’s execution. This includes the initial user request, intermediate reasoning steps, context retrieval, tool calls, and final outputs, all linked in a clear parent-child structure.
Advanced debugging capabilities, such as time-travel or replay functionality, let you step through an agent’s execution sequentially and pinpoint exactly where failures occur, whether that is a hallucination, a tool misuse, or an unintended loop.
Online and Offline Evaluation Frameworks
Logging data alone is not enough without a way to assess its quality. Choose a platform that provides ways to evaluate the quality of agent outputs across key criteria such as correctness, relevance, faithfulness, sentiment, and bias.
To scale this, platforms should combine offline evaluations with automated scoring on production traffic. LLM-as-a-judge methods are particularly useful because they enable continuous evaluation of all interactions, rather than relying on limited manual sampling.
Alerting and Feedback Loops
Effective monitoring platforms include adaptive alerting systems that surface meaningful anomalies without overwhelming teams with noise. Alerts should focus on issues, such as runaway loops, latency spikes, sudden increases in error rates, or abnormal tool usage patterns.
Beyond alerting, look for platforms that surface these alerts to teams seamlessly with intuitive dashboards. This supports faster debugging, prompt refinement, and overall agent optimization.
Enterprise Security and Governance
For production deployments, enterprise-grade security and governance capabilities are essential. Ensure the platform supports compliance standards such as SOC 2, HIPAA, or other relevant frameworks, depending on the use case.
Also check for strong data protection features such as PII redaction, role-based access control, and secure deployment options like virtual private cloud hosting. These safeguards ensure that sensitive data remains protected while still allowing full visibility into agent behavior.
Cost Analytics and Infrastructure Visibility
AI agents' unpredictable resource usage can quickly drive up operational costs. A robust monitoring platform should therefore provide granular cost tracking that attributes token usage and AI spend to specific workflows, sessions, or individual agents.
This financial visibility should be paired with standard infrastructure metrics, such as latency, throughput, and error rates across underlying model providers. Together, these metrics help teams understand both the performance and economic efficiency of their systems.
Get Started With Revenium
Many monitoring platforms do a good job of covering the performance layer, such as traces, latency, and task success rates, but fall short when it comes to cost efficiency and measuring the actual business value their agents generate.
Revenium addresses this gap by linking agent execution data directly to cost attribution and business outcomes, giving engineering and FinOps teams a unified view of what is actually driving AI spend.
If you're running agents in production and need end-to-end visibility into behavior, performance, and cost in one place, Revenium is built for that. Sign up for free to understand what your agents are really costing you.


